The Assay Vault
Every Lab Number On File, 1973–2023 — Sample by Sample, Certificate by Certificate
Page 2 told the story. This page is just the numbers.
Every assay in this file is a real lab certificate — a smelter settlement, an independent assay office, or an XRF spectrometer report — and we’re showing you all of them, not a hand-picked highlight. Some samples are strong. A couple are weak. That’s what a real sample set looks like, and it’s more convincing than a listing that only shows you the good ones.
Quick Reference: Every Assay on File
| Date | Source | Sample | Cu % | Ag oz/ton | Au oz/ton |
|---|---|---|---|---|---|
| 8/31/1973 | Inspiration Consolidated Copper Co. | Smelter shipment | 38.0 | 4.54 | 0.030 |
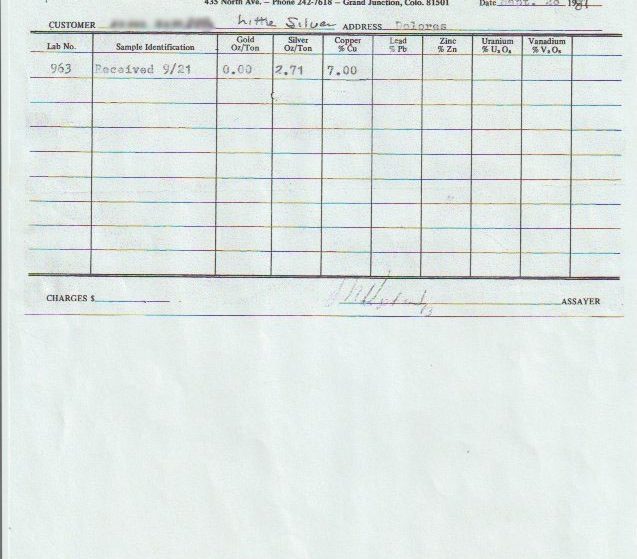
| 9/28/1981 | John C. Kephart & Co. | Lab #963 | 7.00 | 2.71 | 0.00 |
| 3/19/1986 | Colorado Assaying Co. | Sample P-2 | ~10 | 3.70 | trace (<.01) |
| 6/1986 | Skyline Labs Inc. (via USFS) | 612861–612866, avg. of 6 | 0.16–3.95 | trace–1.49 | — |
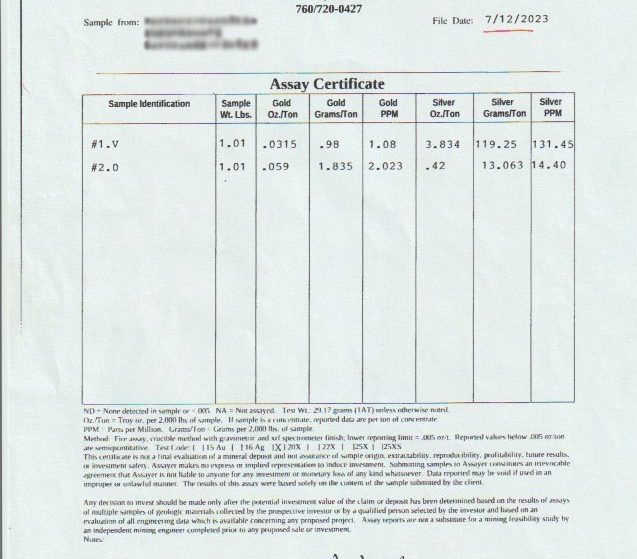
| 7/12/2023 | Reed Laboratories | #1.V | 33.84 | 3.834 | 0.0315 |
| 7/12/2023 | Reed Laboratories | #2.O | 5.62 | 0.42 | 0.059 |
| 10/17/2023 | Reed Laboratories | #1 V.L.M. | 7.45 | 0.345 | 0.035 |
| 10/17/2023 | Reed Laboratories | #2 V.L.M. | 14.19 | 2.118 | 0.1079 |
| 10/17/2023 | Reed Laboratories | #3 V.L.M. | 4.49 | 0.547 | 0.0568 |
| 10/17/2023 | Reed Laboratories | #4 V.L.M. | 17.93 | 3.028 | 0.1097 |
| 10/17/2023 | Reed Laboratories | #5 V.L.M. “Blue Rock” | 27.93 | 2.849 | 0.1396 |
Fourteen individually-sampled results across four labs and fifty years. The Skyline Labs figures are the range and are broken out sample-by-sample on Page 2. All other rows are single hand or XRF samples — see “What These Numbers Mean” below before you extrapolate a resource from them.
The Early Numbers
The oldest number in the file isn’t a lab estimate at all — it’s an actual smelter payment. Inspiration Consolidated Copper Co.’s smelting department settled a 2,000-lb shipment from the Little Silver Mine on August 31, 1973, at 38% copper, 4.54 oz/ton silver, and 0.030 oz/ton gold, for a net value of $94.38 a ton after deductions. That’s covered in more detail on Page 2 — it’s here again because it’s the earliest hard number in the file and it belongs in any list of the assays.
Eight years later, John C. Kephart & Co.’s Grand Junction Laboratories ran an independent sample submitted from Little Silver, Dolores, received September 21, 1981: 7.00% copper, 2.71 oz/ton silver, no measurable gold. Lower than the smelter shipment, and a useful reminder that this deposit isn’t uniform — which the rest of this page bears out repeatedly.
Two Independent Reads, Same Year
1986 produced two separate assays from two separate labs, run for two different reasons. The Colorado Assaying Company in Denver ran a spectrographic analysis in March, submitted from the Little Silver Mine: roughly 10% copper and 3.70 oz/ton silver, with the assayer noting the copper and silver contents were “of commercial interest & value” — the full quote is on Page 2. Three months later, the U.S. Forest Service’s own examination sent six channel and chip samples, cut directly from the underground workings, to Skyline Labs Inc. Those six came back anywhere from 0.16% to 3.95% copper, with silver from a trace up to 1.49 oz/ton — the full sample-by-sample breakdown, with rock type and sample method for each, is on Page 2 alongside the mine plan map showing exactly where each one was cut.
Read together, the two 1986 assays tell a consistent story: a single grab sample from the workings can run around 10% copper, while a systematic set of channel samples across the same mine averages closer to 2%, because a channel sample necessarily includes barren rock between the rich streaks. Both are real. They’re measuring different things.
Reed Laboratories, Two Rounds of Testing
The most recent numbers on file come from Reed Laboratories in Carlsbad, California, in two separate submissions five months apart. Both used fire assay for gold and silver and X-ray fluorescence spectrometry for everything else, including copper and the full platinum-group panel.
July 12, 2023 — Two Hand Samples
The first submission was two samples, #1.V and #2.O, each just over a pound. Sample #1.V came back at 33.839% copper (676.78 lbs per ton of material), 3.834 oz/ton silver, and 0.0315 oz/ton gold — the single richest copper number in the entire file. Sample #2.O ran lower: 5.617% copper, 0.42 oz/ton silver, 0.059 oz/ton gold, actually the higher of the two in gold.
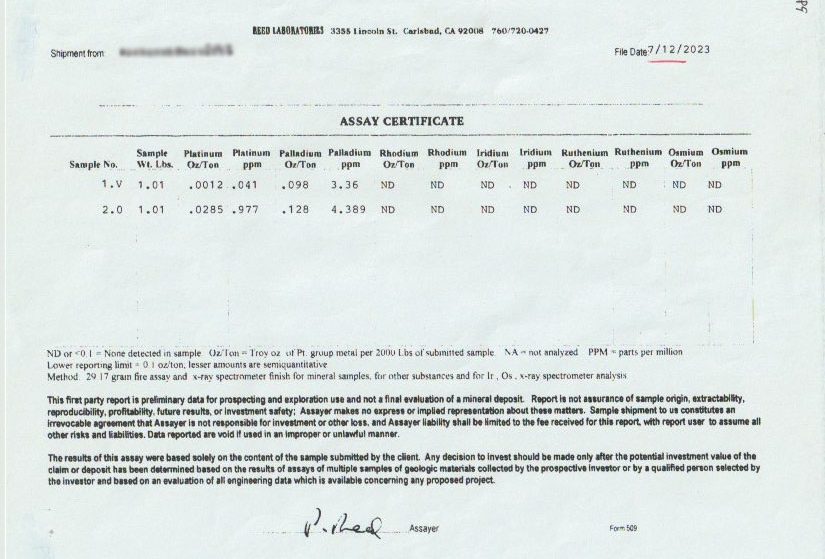
The same submission included a full platinum-group-element panel. Sample #1.V returned 0.0012 oz/ton platinum (0.041 ppm) and 0.098 oz/ton palladium (3.36 ppm); sample #2.O returned 0.0285 oz/ton platinum (0.977 ppm) and 0.128 oz/ton palladium (4.389 ppm). Rhodium, iridium, ruthenium, and osmium were all non-detect in both samples. We’re flagging the oz/ton and ppm figures together here because it’s an easy pair of columns to misread on the original certificate — the ppm number is roughly 34 times the oz/ton number for the same sample, not a separate, larger deposit.
October 17, 2023 — Five More Samples, Including “Blue Rock”
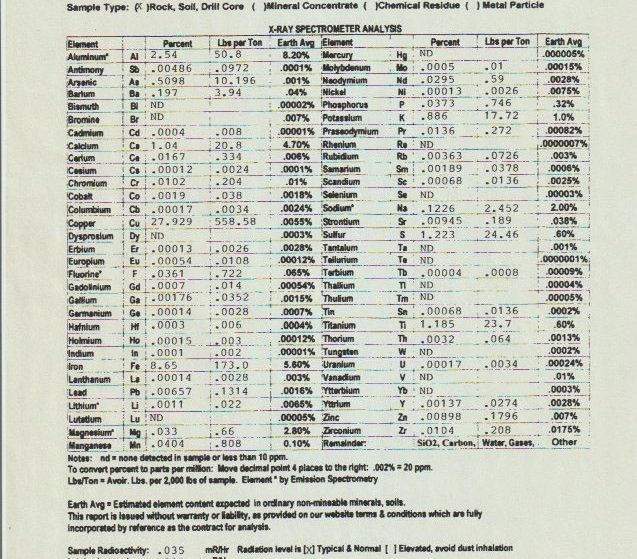
The second submission, three months later, was five samples labeled #1 through #5 V.L.M., run by full XRF spectrometer scan across dozens of elements. Copper ranged from 4.49% (sample #3) up to 27.929% (sample #5, hand-labeled “Blue Rock” on the certificate) — the second-richest copper number in the file, behind only the July #1.V sample. Gold ranged from 0.035 to 0.1396 oz/ton across the five, and silver from 0.345 to 3.028 oz/ton. Sample #5 “Blue Rock” carries the best combination of the two: 27.929% copper alongside the highest gold value of the batch at 0.1396 oz/ton.
A Note on What These Numbers Mean
We’d rather tell you this straight than let you find it out later. Every assay on this page — the smelter shipment aside — is a grab sample, a hand-picked specimen, or a narrow channel cut, not a drill-defined resource. That’s standard practice for a claim at this stage, and it’s exactly what fourteen samples across four labs and fifty years is supposed to demonstrate: that the copper mineralization here is real, it’s not a one-time fluke, and it runs rich in more than one place on the claim. It is not a JORC or SEC-compliant resource estimate, and nobody involved in producing these certificates has claimed it is. If you’re evaluating this as an investment rather than a prospecting opportunity, budget for your own systematic sampling program before you size a mine plan around any single number on this page — including the 33.8% and 27.9% figures, which are real, but are two samples, not a tonnage.
All fourteen original lab certificates, plus the 1986 USFS Mineral Report and every historical document on Page 2, are in the two downloadable zip files linked in the sidebar. Nothing on this page is summarized from a source we haven’t also handed you directly.
All Active Claims at a Glance
Every claim currently for sale, sorted by price. Tap a name to open the full listing.
| Claim | Price | Commodity | County / State | Acreage |
|---|---|---|---|---|
| The Virginia Lynn you’re here | $1,000,000 | Silver, Gold, Copper +4 | Dolores County, Colorado | 87.64 |
| The Sedona Legend & Sunrise Claims | $71,980 | Gold | Yavapai County, Arizona | 80 |
| Mountain View Tungsten Project | $65,000 | Tungsten, Copper | Lyon County, Nevada | ~140 |
| Ophy I-V Claims | $41,250 | Gold, Silver, Copper | Boise County, Idaho | 79.35 |
| Sunny Side Up #1-2 | $21,500 | Gold, Silver | Southeast Fairbanks, Alaska | 80 |
| Boulder #2 & #3 | $15,000 | Gold, Silver | Boise County, Idaho | 41.32 |
| The Winna-Winner Claims | $10,000 | Gold, Silver, Iron +2 | Humboldt County, Nevada | 40 |
| Belcher Canyon | $9,997 | Gold | Nye County, Nevada | 20 |
| The Golden Trinity Claim | $8,000 | Gold, Platinum, Silver | Trinity County, California | 20 |
| Marigold #1 | $7,500 | Gold, Silver | Yavapai County, Arizona | 20 |
| Ayers Claim | $6,500 | Gold, Silver | Sierra County, California | 20 |
Prices and availability change as claims sell. Ask about any of these or see what has already sold.